Walmart-backed PhonePe controls 47.61% of market share by value and 46.9% by volume of transactions in the country with INR 2.88 Lakh Cr worth of transactions
Google Pay followed with 38% share by value and 35.2% share by volume with INR 2.3 Lakh Cr worth of customer transactions processed
IPO-bound Paytm saw its transaction volumes grow 18% during the month, faster than Google Pay and PhonePe at 15% eac
The latest data from National Payments Corporation Of India (NPCI) for the month of July shows that Walmart-backed PhonePe saw a drop in its share of unified payment interface (UPI) customer transactions in value and volume marginally month on month. However, PhonePe continues to lead the market with 47.61% of market share by value and 46.9% by volume of transactions.
PhonePe processed customer transactions worth INR 2.88 Lakh Cr during the month. This is marginally lower than 47.73% transaction value share and 47% volume market reported by PhonePe in June.
Google Pay followed with 38% share by value and 35.2% share by volume with INR 2.3 Lakh Cr worth of customer transactions processed during the month. In June it had reported 37.8% market share by value and 35.3% share by volume. Note that NPCI requires the third party apps to enforce 30% share by volume by January 2023.
In a distant third place, Paytm Payments Bank commanded 7.6% market share by value and 12.2% share by volume, which is marginally higher than its June numbers.
During July, the NPCI clocked a record 3.24 UPI Bn transactions by volume, up 15.7% month-on-month. It also reported transactions worth INR 6.06 Lakh Cr up 10.8% month-on-month.
Interestingly, IPO-bound Paytm saw its transaction volumes grow 18% during the month, faster than Google Pay and PhonePe at 15% each. Kunal Shah-led CRED saw 23% growth in transaction volumes, the highest among the top UPI apps. CRED commands 1.34% market share by value of UPI transactions.
Launched in 2016, UPI transactions volume saw the first massive dip in April 2020, after falling below the 1 Bn mark to 990 Mn, while the value of transactions dropped to INR 1.51 Lakh Cr. This fall was in the wake of the Covid-induced lockdown and restrictions that shut down all major services including traveling, dining out, ecommerce and offline transactions.
After recovering post May 2020, UPI crossed the 2 Bn transaction mark in October 2020. In March 2021, UPI had reported its best-ever figures with 2.73 Bn transactions amounting to INR 5.04 Lakh Cr. The lockdowns imposed during the second wave from April 2021 severely impacted payments. But with the economy reopening since June, UPI transactions have gone through the roof crossing the 3 Bn transaction milestone in July.
While UPI growth is just one indicator of digital payments growth, the Reserve Bank of India’s digital payments index in March 2021 rose to 270.59, compared to 207.84 for March 2020, indicating a robust growth in digital transactions during the Covid-hit year in the country. The central bank announced the construction of the composite Digital Payments Index (RBI-DPI) with March 2018 as the base period to assess the extent of digitization of payments in the country.
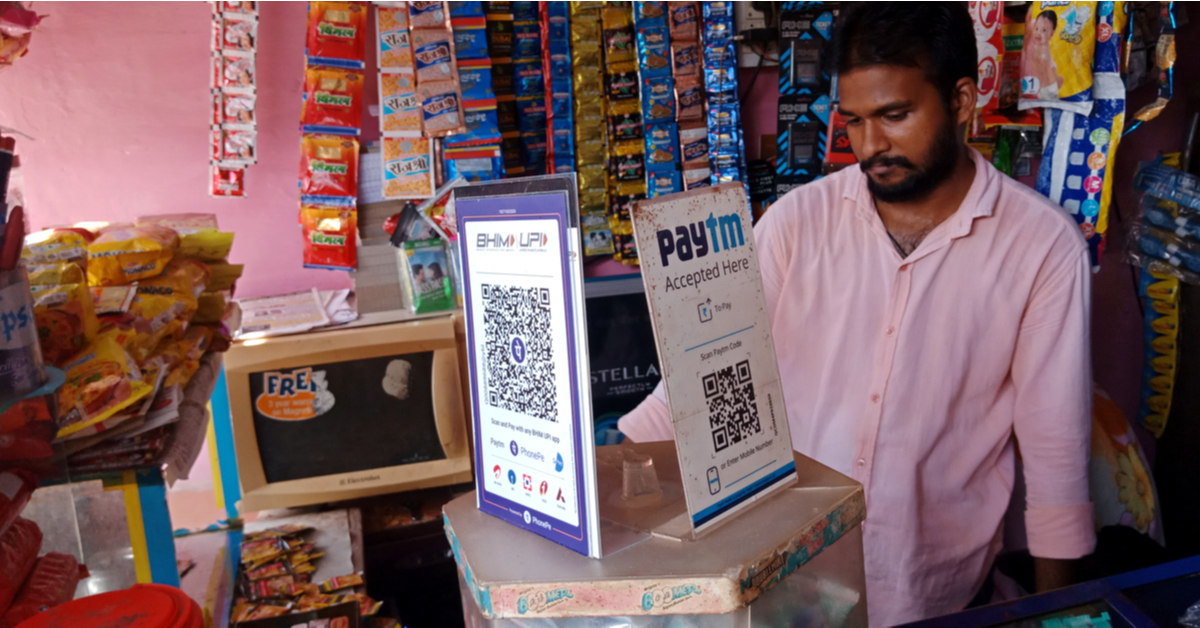
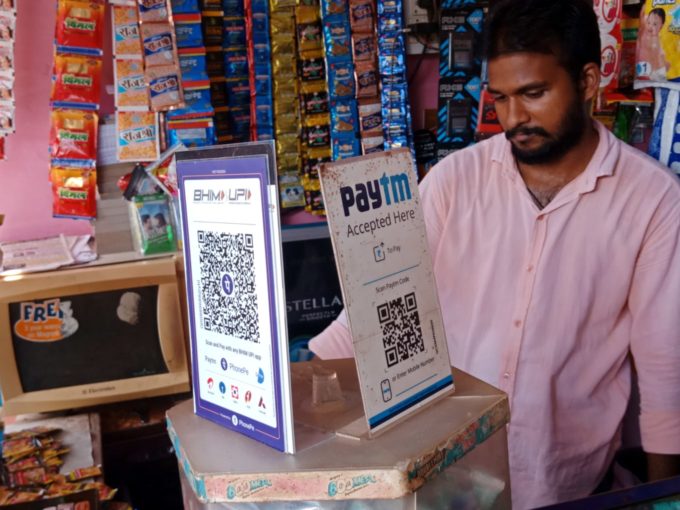
As reported earlier by Inc42, a large part of the usage is coming from in-store UPI payments across tier 2 and 3 cities where credit and debit cards failed to find mass acceptance.


![Read more about the article [Funding Galore] Over $130 Mn Raised By Indian Startups This Week](https://blog.digitalsevaa.com/wp-content/uploads/2021/09/Social_Image-300x157.jpg)