
As B2B businesses, we’re not posting on social media just for kicks and giggles. We’re looking to boost engagement, generate more leads, build brand awareness, close more deals, and the list of KPIs goes on.
So how do you understand whether or not you’re reaching these goals? When you dive into the analytics of the native platforms, the types of metrics you see can vary based on the channel. With all that data sitting siloed on different platforms, it’s difficult to get the full picture of your social performance.
Although UTMs are a common solution, they miss vital pieces of the puzzle that will help you tie social media directly to revenue and position you as an invaluable member of your organization.
So if none of these options are the best solution for measuring social, what is?
We’ll share the metrics you should start measuring now if you want to tie your social content directly to business results.
Jump to Section:
- The Problem with UTMs
- Best Metrics for Measuring Social ROI
- Engagement Metrics
- Audience Metrics
- Content Metrics
- Advocacy Metrics
- Conversion Metrics
- Diving Deeper: Tips for Analyzing Your Social Media Data
- From Stats to Reports: How to Highlight Your Success
- Summing it Up
The Problem with UTMs
Before we dive into the best analytics for measuring your socials, let’s talk about UTMs.
UTMs are a great way to measure certain aspects of your social media performance. They’ll help you understand which social media channels, campaigns, and posts get the most clicks and generate the most traffic to your website.
UTMs can track the following parameters:
- Source: Where your incoming traffic comes from (i.e. Linkedin)
- Medium: The specific kind of campaign that brought traffic (i.e….. social media)
- Campaign: The title of your campaign (i.e. employee advocacy)
- Terms: Keywords you’re tracking (generally used for paid campaigns)
- Content: The piece of content that was clicked on (i.e. recruitment video)
While this data provides insights, it’s limited in understanding your audience and conversion drivers. Questions like who became customers after interacting with specific content or the dollar value of social campaigns are challenging to answer with UTMs alone.
UTMs measure clicks and website traffic but lack depth on the who, why, how, and ultimate outcomes.
Best Metrics for Measuring Social Media ROI
According to the 2023 Social Media Marketing Industry Report, 54% of Social Media Managers aim to boost leads and sales. But doing so is easier said than done.
To measure success effectively, align metrics with your specific goals and your company’s definition of success. We suggest putting your metrics into categories that correlate with specific priorities as follows:
Engagement Metrics
Engagement metrics are key to understanding the interactions between your audience and your brand. A high level of engagement generally means that your audience is interested in your content and down the line, may have good potential to become a customer.
Here are some must-have engagement metrics that you should be tracking:
- Impressions: The amount of times your content is displayed on social channels
- Engagement type: Likes, comments, clicks, shares, dislikes, new followers, link clicks, etc.
- Number of engagements: How many of the above actions are taken on a specific post
- Engagement rate: The number of engagements compared to your overall reach
- Engagement by Network: The social media networks where your users engage most with your brand
- Engagement by Date and Time: The days of the week and times you should post for maximum engagement
- Most engaging campaigns: Campaigns that received the most interactions from your target audience
Notice how we didn’t say reach here. That’s because the number of people who see your content is meaningless if they aren’t comprised of the right people. You wouldn’t want to be talking about burgers to a room full of vegans. The same goes for social media.
That brings us to our next point about audience-related metrics.
Audience Metrics
Knowing your audience is vital to any successful social media strategy. If you don’t know your audience, your content will continuously miss the mark instead of working like a magnet that draws leads directly to your brand.
Measuring the following metrics will help ensure you know who your audience is and how you can turn them from passive onlookers to qualified leads:
- Audience growth overtime: How much has your audience increased or decreased over a specific period
- Sentiment analysis: What your users think of your brand. Is it positive, negative, or neutral?
- Share of Voice: How dominant is your brand when it comes to industry-related conversations? How does it compare with competitors?
- Mentions: The number of times your audience uses your brand name and in what context
- Location: Understand which countries and cities your followers come from
Top Influencers: Which of your users interact most with your brand? Ideally, it’s also important to know which industries they work in, their job title, and the company to see if they fit your ICP.
Content Metrics
You can write all the high-quality content in the world, but if it is irrelevant to your audience, your content will be a flop.
Here’s the data you should track to understand whether or not your content is doing the trick:
- Trending hashtags: Which hashtags are your followers using and interacting with most?
- Trending topics: Which topics that you share are generating the most engagement?
- Content Performance: How many likes, clicks, shares, and conversions does a specific piece of content generate?
- Engagement by content type: Which types of content does your audience interact with most? (video, gallery, link, PDF, text, GIF, etc.)
- Best performing posts: Which of your social posts has gotten the best response from your audience? It’s best if you can filter this by different types of engagements as well.
- Video views: How many people are watching your video?
- Watch time: Is your audience viewing the entire video? If not, how long are they watching it for? Get even more granular by understanding your watch time per network.
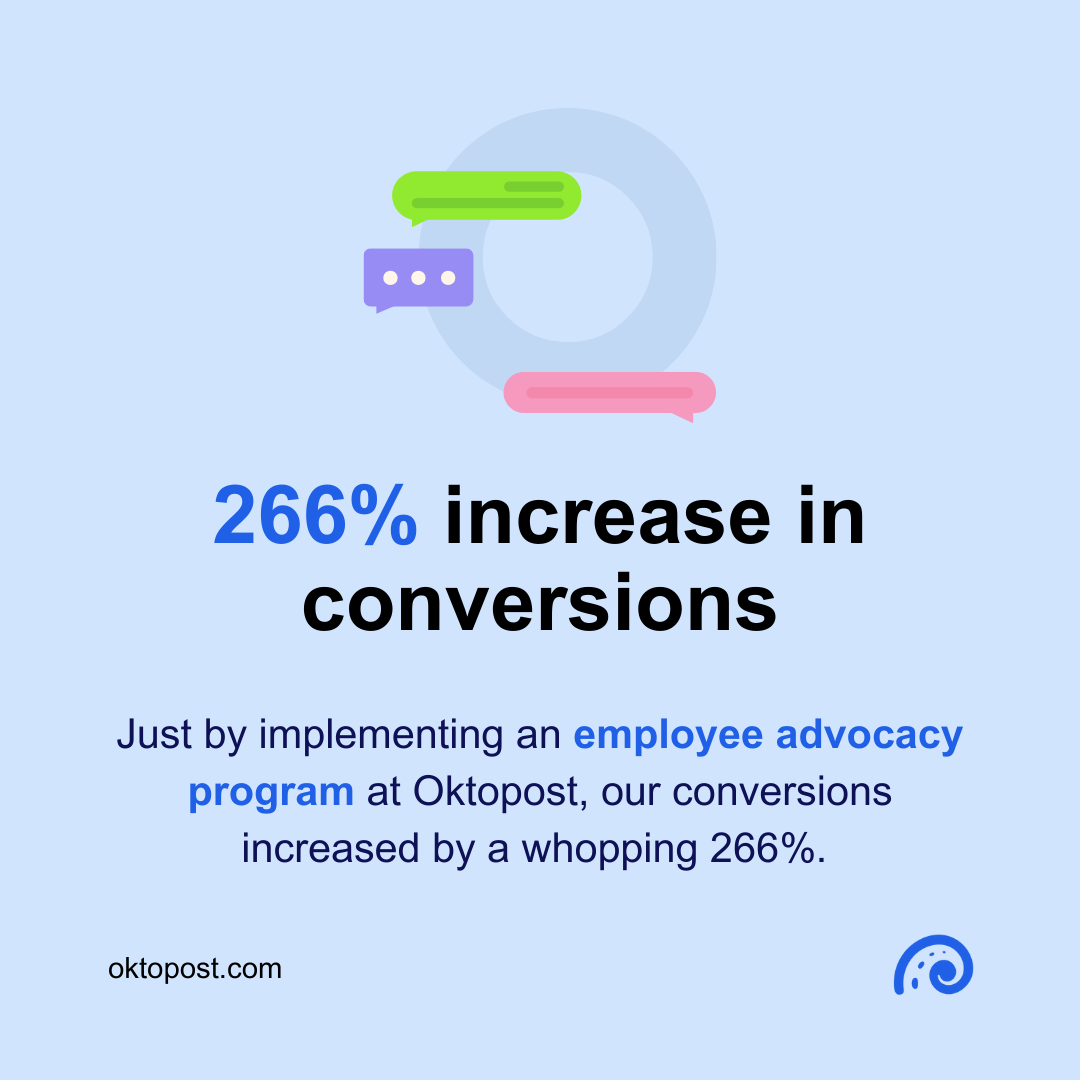
Advocacy Metrics
If you don’t already have an employee advocacy program, you should definitely make that a priority. At Oktopost, we were able to increase our conversions by a whopping 266%, just by implementing employee advocacy.
Of course, we only truly grasped the impact of employee advocacy on our lead-generation strategy by closely examining the right metrics. Here are some suggestions for metrics we recommend measuring:
- Engagements per month: The number of posts, clicks, conversions, and engagements each month
- Engagements per network: The social networks that generate the most engagements and conversions
- Engagements per content type: The types of content (videos, links, text, etc.) that get the most interest from your advocates’ audiences
- Influenced opportunities: The number of opportunities that are generated through employee advocacy content as well as their predicted ARR
- Post-to-conversion ratio: The number of posts that were clicked, and how many of those clicks ended in conversion
- Advocacy performance: Who your top advocates are and how many engagements have they achieved
- Advocate edit ratio: The percentage of your captions that are being edited by your advocates. Since unique and authentic content always yields higher performance, the more edits, the better.
- Message performance: The captions that are resonating most with your advocates’ audiences
Conversion Metrics
Engagements are nice, but conversions are what brings the money in. If you really want to quantify social media’s impact on your business’s bottom line (and make yourself invaluable to your organization), you’ll need to measure the following:
- Top converting links: Which blogs, webinars, articles, case studies, or other links have driven the most conversions
- Top converting campaigns: Which campaigns had the highest conversion rates
- Number of corporate conversions: How many conversions have your corporate channels produced?
- Number of advocacy conversions: How many conversions originated from advocacy?
- Conversion rate: The number of conversions per interaction
- Conversions per channel: How many conversions did each social media network produce?
Diving Deeper: Tips for Analyzing Your Social Media Data
To truly understand your social media performance, build out your metrics based on your company’s specific marketing goals. Make sure to compare, benchmark, and zoom out to get the entire picture.
For example, don’t solely rely on monthly impressions; compare it with engagement. High impressions with low engagement are a red flag – it means your content is being seen but not interacted with. Ideally, impressions and engagements should be similar.
Don’t look at the metrics alone. Instead, drill down into them to get the full story. For example, say you have a spike in engagement. On the surface, that number may look positive but if those engagements are all negative comments or from people who are not part of your target audience, you’ll need to reevaluate your content.
Measure engagement metrics regularly (monthly, quarterly, or yearly) to track your growth. The same applies to follower counts; aim for continuous growth.
If you have an advocacy program, compare its metrics to your corporate account to gauge the performance of each program.
Lastly, measure engagement rates by content type for both corporate and advocacy posts. This helps you understand what each audience prefers so you can continuously improve your strategy.
From Stats to Reports: How to Highlight Your Success
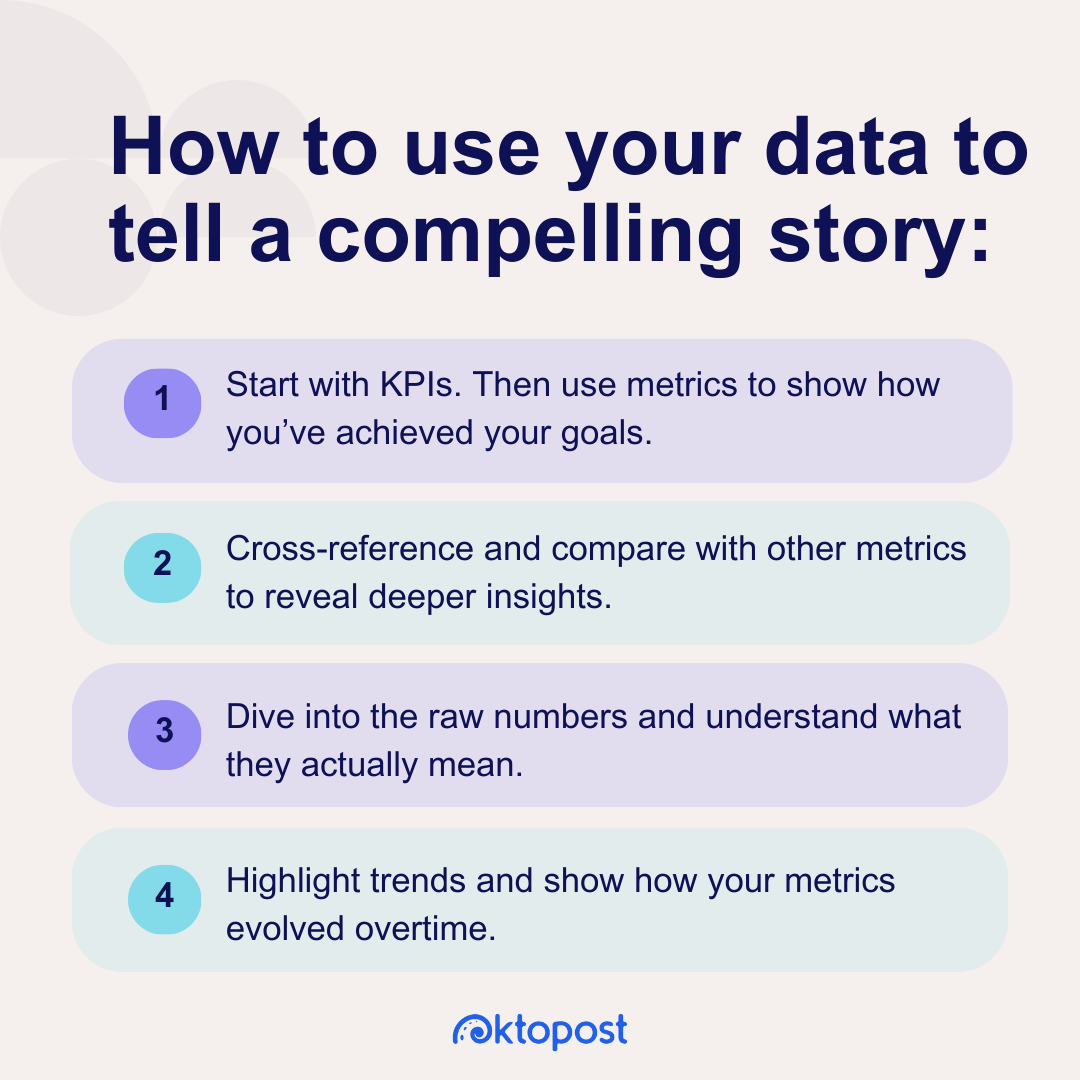
How do you make yourself indispensable to your organization? By showcasing your success with a data-rich, easy-to-read report. Crafting an effective social media performance report involves using your collected data to tell a compelling story.
Make sure to consider your audience’s preferences. For instance, your executives may prioritize conversions, ROI, and closed deals over likes or impressions.
Construct a narrative that spotlights the given KPIs, using metrics that demonstrate your achievement of these goals. In essence, start with the end goal and employ your metrics to support your case.
For added convenience, we’ve recently introduced a Reports Gallery, featuring pre-built reports based on common use cases. This allows you to create reports following industry best practices with just a few clicks.
Summing it Up
Metrics and reporting, while not the most thrilling, are vital in social media management. They allow you to highlight your content’s impact, creativity, and effort in driving audience engagement, leads, and revenue.
Using the right metrics, you can demonstrate social media’s role in revenue generation, gaining support for future initiatives, while enabling your hard work to shine through.


![Read more about the article [Funding alert] Stockwits raises $30M, to launch in India by Q2 2022](https://blog.digitalsevaa.com/wp-content/uploads/2021/12/stock-trading-1594883703236-300x150.png)