Endless streams of online content are eroding our attention spans. What buyers, either B2C or B2B, scrolling through TikTok and buyers perusing LinkedIn have in common is that hordes of marketers are always clamoring for their attention. And we can already see the impact of this steep competition.
Comparing year over year, many professionals report that overall post reach on LinkedIn has plummeted by 66%, while average engagement dropped by 16%. Shifts like these call for an immediate adjustment to your strategy, but to catch them in time, you need to track the metrics they impact first.
Understanding which performance indicators to focus on affects your ability to evaluate and optimize your campaigns. When measuring social media performance, there is one long-debated question: Which key metric is more critical, impressions or engagement?
What are impressions?
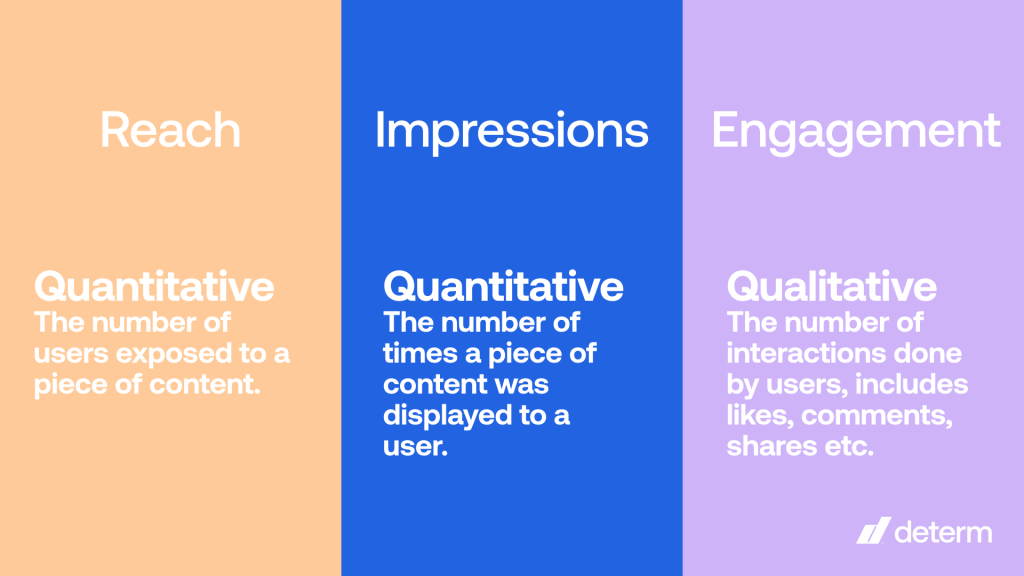
Impressions refer to the number of times a piece of content is displayed/shown to a viewer. They don’t have to have clicked on or even noticed it; it just has to have shown up on their screen. You can count multiple impressions on the same viewer, so if your content pops up on one person’s feed three times, that counts as three impressions.
Impressions don’t tell you how well a piece of content connects with its audience or how well they are progressing in your demand generation funnel. However, they can help determine if you are distributing your content effectively.
What is engagement?
Engagement measures interaction with your content, such as clicks, comments, likes, or shares. It can only be counted if the viewer takes some action in response to the content.
Engagement is an important metric that tells you how well a piece of content captures your audience’s attention and motivates them with compelling calls to action. This metric is commonly monitored in A/B testing to see what ads or social media posts are more likely to get viewers to click.
Impressions vs. Engagement on different social channels
Every social media platform has its way of tracking social media data like impressions and engagement. To accurately measure and compare performance between platforms, you need to look at how they approach this:
Facebook: An impression is counted every time content from (or related to) your Facebook page is displayed to a viewer, either through their news feed, search, paid ads, or direct navigation to your page. Like LinkedIn, the engagement rate is calculated based on reactions, comments, shares, and clicks.
YouTube: The impressions statistic tells you how many times a video’s thumbnail was displayed in a user feed. YouTube measures engagement through likes, dislikes, comments, shares, and the overall view duration of your videos. The engagement rate is often determined by views divided by impressions or reach.
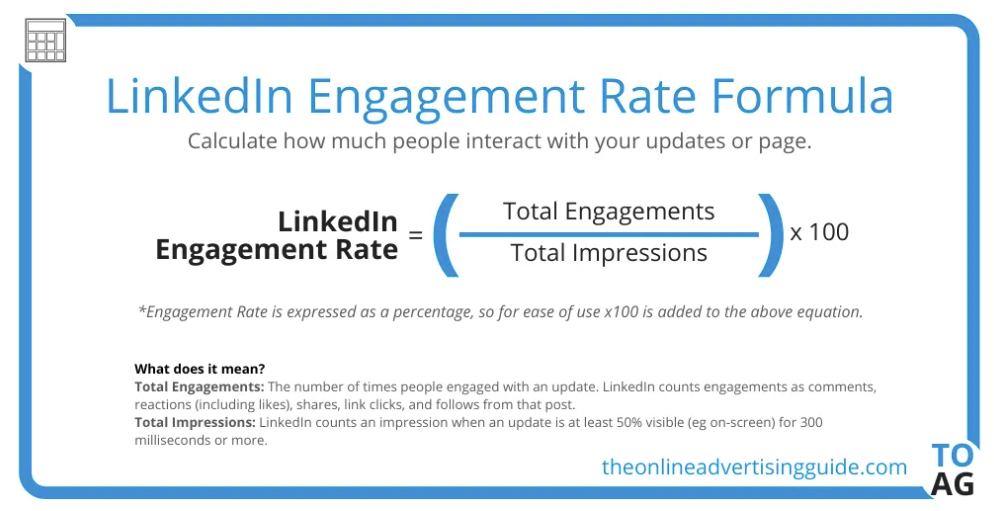
LinkedIn: You can view the impressions each post received. LinkedIn also offers some demographic data on the accounts viewing your content so that you can dive deeper into your impressions and engagement based on your target personas.
Instagram: The engagement rate can be calculated by followers (helpful to see overall audience interaction) or by reach (useful for understanding content effectiveness in reaching users). Engagement on Instagram includes likes, comments, shares, and saves.
X: Contrary to popular belief, B2B marketing on X isn’t dead. Aside from impression statistics for each post, X’s analytics toolkit includes engagement rates, clicks, and follower trends. Engagement is calculated based on reposts, likes, replies, and profile clicks, and the engagement rate is often based on engagements per impression.
Pay-per-click (PPC) ads and other forms of content with interactivity built in will often have their ways of tracking and reporting on engagement.
Impressions vs Engagement: Which should you report on?
With content piling up everywhere and consumer attention spans stretched to their limits, the metrics you choose to report on can make or break your social media marketing strategy. Your campaign goals determine your reporting priorities, and you should set appropriate KPIs early in the planning process.
Impressions give you a sense of your overall visibility and potential reach. If raising brand awareness is your goal, impressions may be your key performance indicator. They can tell you if you’re showing up in the right place at the right time, but they don’t tell you if you deliver the right message.
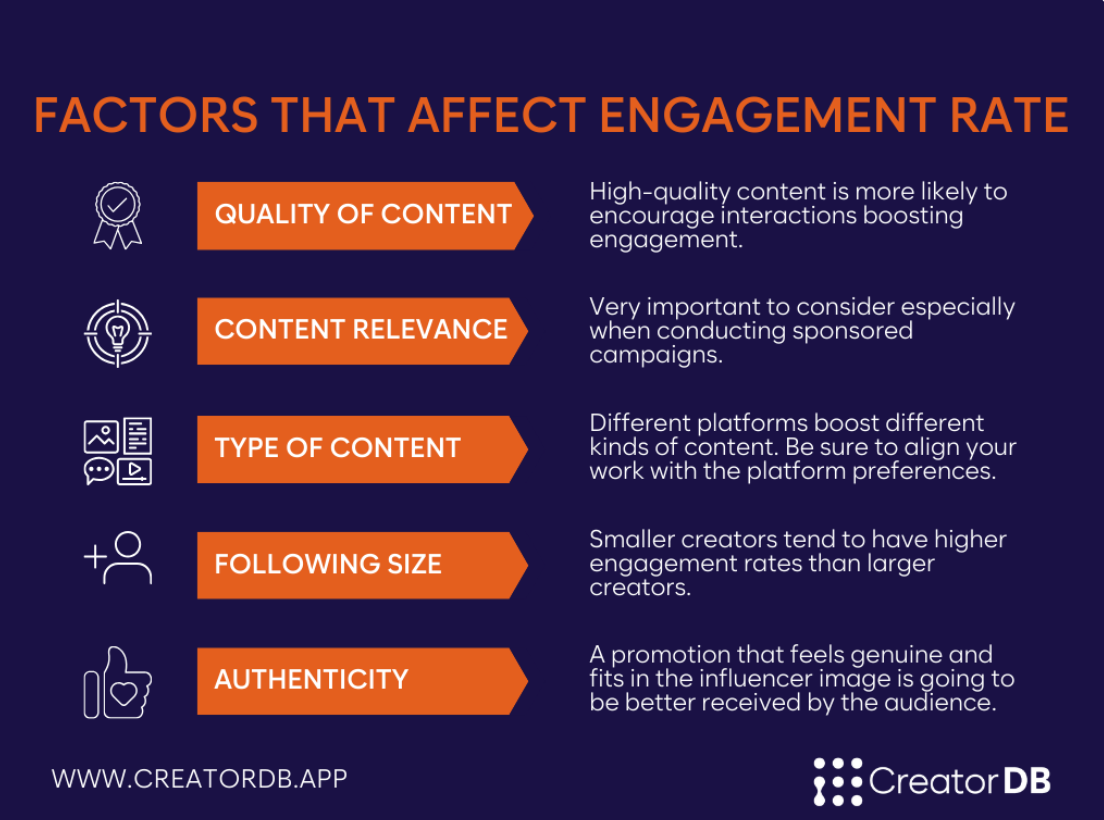
Engagement usually indicates that you’re giving your audience content they find relevant and compelling (although controversial posts can generate high levels of engagement for the wrong reasons). Engagement rates can tell you what content types perform best, which headlines and thumbnails are the best attention-grabbers, and which audience segments are the most responsive.
Analyzing impressions and engagement together can reveal a lot. For example, a post with a high number of impressions but a comparatively low engagement is succeeding at reaching a broad audience but failing to entice them to click. When revising your strategy, consider keeping the targeting criteria but changing the content.
Other key metrics to help you monitor social media ROI
No metric can tell you everything you need about a social media campaign’s performance. You need to monitor many performance indicators to understand how your efforts impact sales and how customers react to and interact with your content.
Here are ten key metrics to help you monitor social media performance and ROI in a B2B context:
- Click-through rate (CTR) is the percentage of viewers who follow a call to action and click on a link in your marketing content. Few metrics give a more precise indicator of the effectiveness of your top-level content.
- Conversion Rate is another metric that relates directly to your primary marketing objectives. It tells you what percentage of visitors to your website are taking some sort of action that advances them further down your sales funnel, like clicking a link, subscribing to email updates, signing up for a sales demo, or registering a customer account.
It may also be helpful to average your conversion rate across all social media platforms to compare your social media efforts to other marketing activities.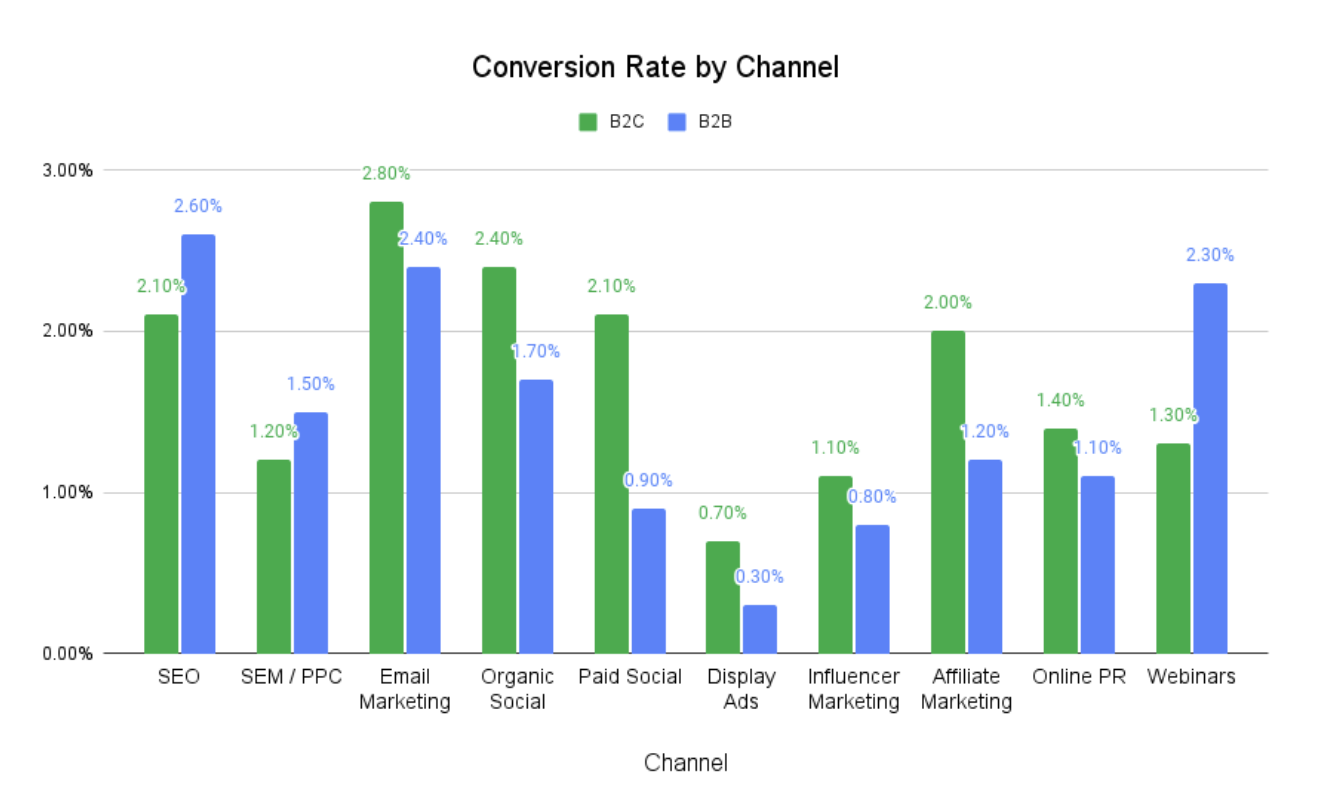
- Cost Per Click (CPC) is the amount you pay every time a viewer clicks on a PPC ad you purchased. Knowing your CPC on each platform is essential for comparing prices and calculating your ROI.
- Customer Acquisition Cost (CAC) is the average cost of acquiring a new customer. It helps determine profitability and assess the performance of your sales and marketing teams.
- Audience Growth Rate measures the percentage increase (or decrease) in your follower count over a specified period. Tracking this rate can help you understand what content and outreach drive growth.
- Website Traffic from Social Media can show you when customers navigate from a social media post to your website, suggesting that they’re finding your content engaging enough to go to the source for more. By tracking these referrals, you can learn how to select traffic-optimizing content. Expert web development companies can help you ensure that your users continue to have a smooth user journey on your website so they eventually convert.
- Lead Generation Rate shows how many website visitors (or viewers engaged on a particular channel) convert to leads. This metric isn’t as easy to track as conversions based on simple actions taken, but it tells you more about how effective various marketing campaigns and channels are.
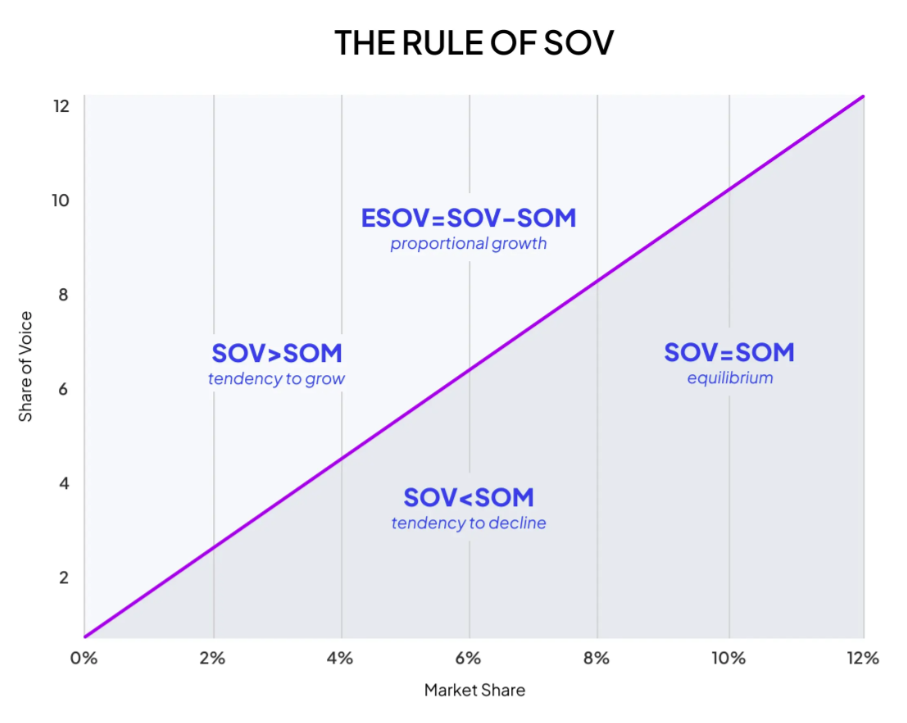
- Social Share of Voice (SOV) compares your direct and indirect mentions against your competition. This comparison can tell you if you’re leading the online dialogue—or struggling to stay included in it. Measuring the Share of Market (SOM) can also be beneficial. Social listening tools can help you monitor the right conversations to get an accurate measurement.
- Return on Ad Spend (RoAS) measures revenue earned for every dollar spent on advertising. When analyzed with ROI, it can clarify the value you’re getting from your digital ad campaigns.
- Customer Lifetime Value (CLV) is a critical metric for strengthening customer relationships and reducing churn. It’s a projection of the total revenue you can anticipate earning from a customer based on factors like purchase history. With CLV, you can identify your most valuable customers and develop strategies to retain them and attract more customers like them.
You can quickly and effectively adjust your strategy when you have a detailed view of what’s happening. You can also integrate social media metrics into your broader optimization strategy to improve customer engagement across email, website, and other digital communications.
The right metrics + The right tools= A winning combination
Without ongoing monitoring, a social media marketing campaign can lose the plot and fail to connect with its target audience or deliver positive results. By carefully tracking the metrics aligned with your marketing goals, you’ll know what changes to make and when to make them. Optimizing your campaigns in real-time is even easier with tools like Oktopost automating your social media management.
Oktopost’s robust reporting and analytics features allow marketers to track key metrics like impressions and engagement, analyze their impact on overall marketing goals, and ensure your team puts their best efforts into social media success. Book a demo today to see how Oktopost can help you launch an innovative content strategy that drives growth.