We speak with about 200 private companies every quarter, and the vast majority of our conversations over the last three months have revolved around one question: What am I worth now?
Many private companies are faced with lower valuations — a down round or secondary trading at lower levels — especially if their last valuation was set in the last year or two, regardless of how much they grew in that time.
The public markets have trended downwards, investor priorities have shifted, and the IPO window is essentially shut, with Q1 IPOs (18 deals with $2.1 billion raised) at their slowest annualized rate in over 10 years.
The recalibration of public stock valuations is very real for high-growth tech companies, and even more so for unprofitable high-growth tech firms. The trickle down effects of this recalibration, along with significant liquidity constraints, are being felt by private companies.
Refreshed valuations
To answer the question of what you’re worth now, we first need to:
- Define where public market multiples are, and where they have come from
- Provide a valuation framework that can be applied to companies
- Apply additional factors that are now impacting valuations — liquidity profiles, changes in investor focus, etc.
What happened with the public markets?
A big drop.
This chart shows the EV/revenue multiple for a bucket of high-growth software (30%+ year-on-year growth) names. Multiples declined 65% from peak (~31x) to trough (~12x) in the last five months. Such a drop has few precedents — this is the first time we’ve seen such a large percentage decline within a peak to trough pullback in the last ten years.
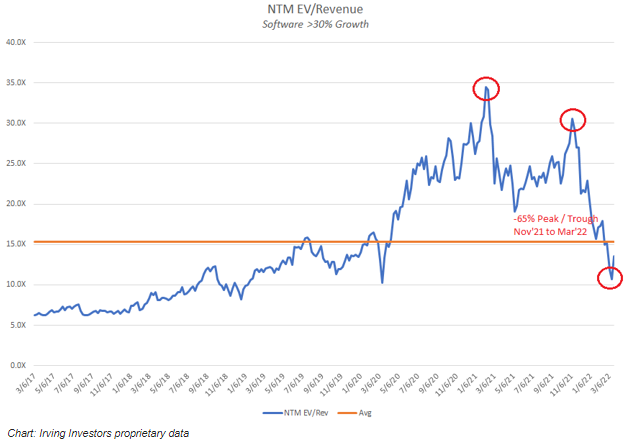
EV/revenue multiples for a bucket of high-growth software companies. Image Credits: Irving Investors
How can we apply this to companies?
While a private company cannot be directly compared to public companies, to find out what a company is worth, we must start by accurately identifying public market comparables.
Average sector revenue multiples (in the chart above) don’t tell the full story, as every company is unique. We have to go a little deeper.
While the market has quickly turned to favor the buyers, the good news is that it isn’t broken.