Paytm saw the number of monthly transacting users increase 22% from 41.2 Mn at the end of the first quarter of FY20 to 50.4 Mn at the end of the first quarter of FY21
During the first quarter of FY22, which was impacted by the second wave of Covid, Paytm’s GMV grew 15.8% to INR 1.47 Lakh Cr
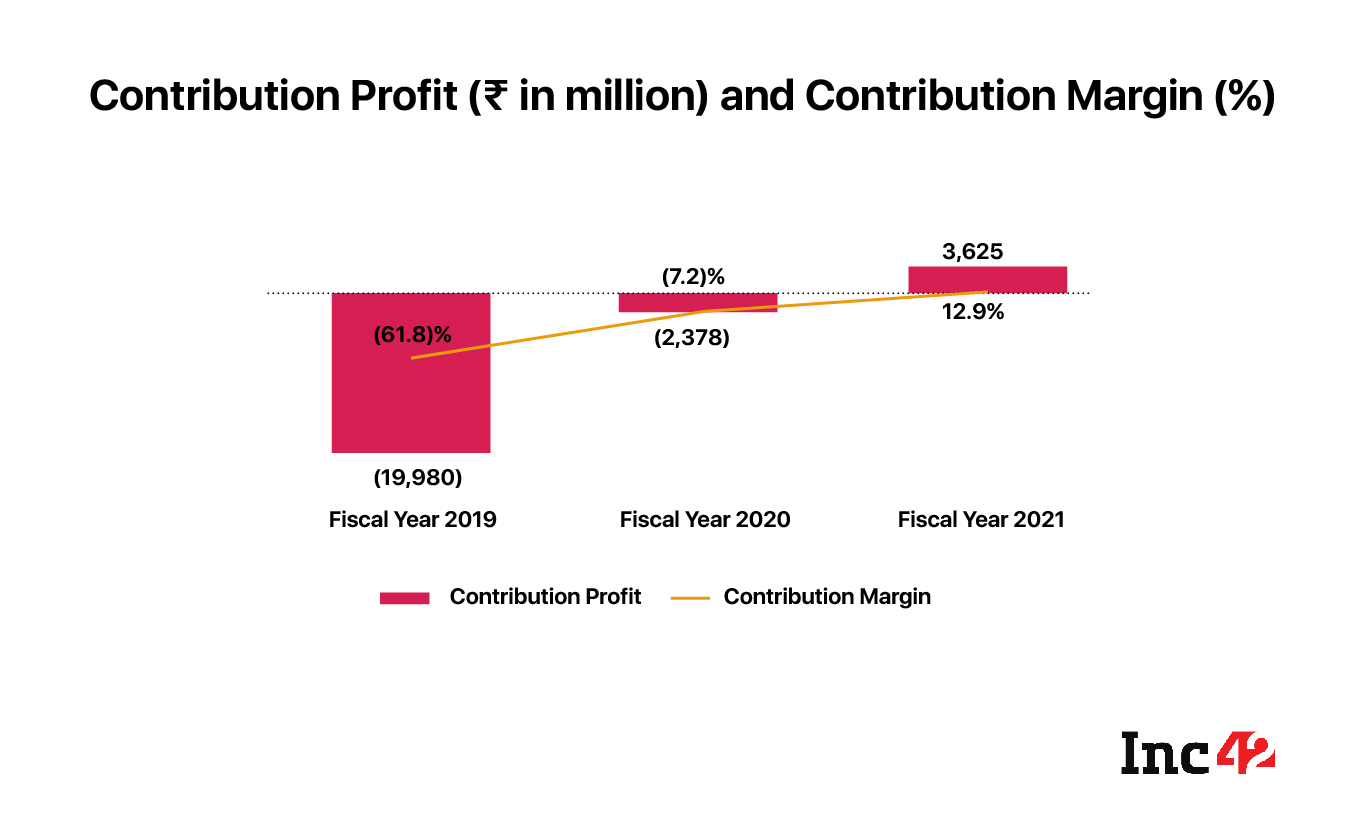
The company is unit economic positive — contribution profit improved from negative (-) INR 1,998 Cr in FY19 to a INR 362.5 Cr in FY21

Fintech major Paytm on Friday (July 16) filed its draft red herring prospectus (DRHP) with capital markets regulator SEBI on Friday (July 16) to raise INR 16,600 Cr in an initial public offering (IPO).
The digital payments giant saw its overall revenue take a hit amid the pandemic as it fell 9.9% from INR 3,540.77 in FY20 to INR 3,186.8 in FY21 on a consolidated basis. On the verge of a $3 Bn initial public offering, the fintech behemoth’s losses narrowed 42% to INR 1,704.01 Cr from INR 2,943.32 Cr in the same period.
The company achieved this on the back of lowering its expenses from INR 6,138.23 Cr in FY20 to INR 4,782.95 Cr in FY21, the company’s annual report showed. While Paytm spent a staggering INR 1,397.05 Cr in marketing in the financial year ending March 2020, the digital payments company tamped down its marketing spend by 62% to INR 532.32 Cr amid the pandemic as digital adoption went up.
According to its DRHP, Paytm saw the number of monthly transacting users (MTU) increase 22% from 41.2 Mn at the end of the first quarter of FY2020 to 50.4 Mn at the end of the first quarter of FY21.
There are more such interesting takeaways from the IPO prospectus. For instance, the dimensions of this fintech behemoth are clear — with INR 4 Lakh Cr of total GMV in FY21, 114 Mn annual transacting users, and 7.4 Bn transactions.
Interestingly, the annualised GMV due to Paytm users who came to the platform in 2017 increased 6.8x by FY21 end. This means that over a period of time, a Paytm user’s spends on the platform keeps on rising at a fast pace.
Let’s take a look at 5 charts that show how Paytm’s business is growing:
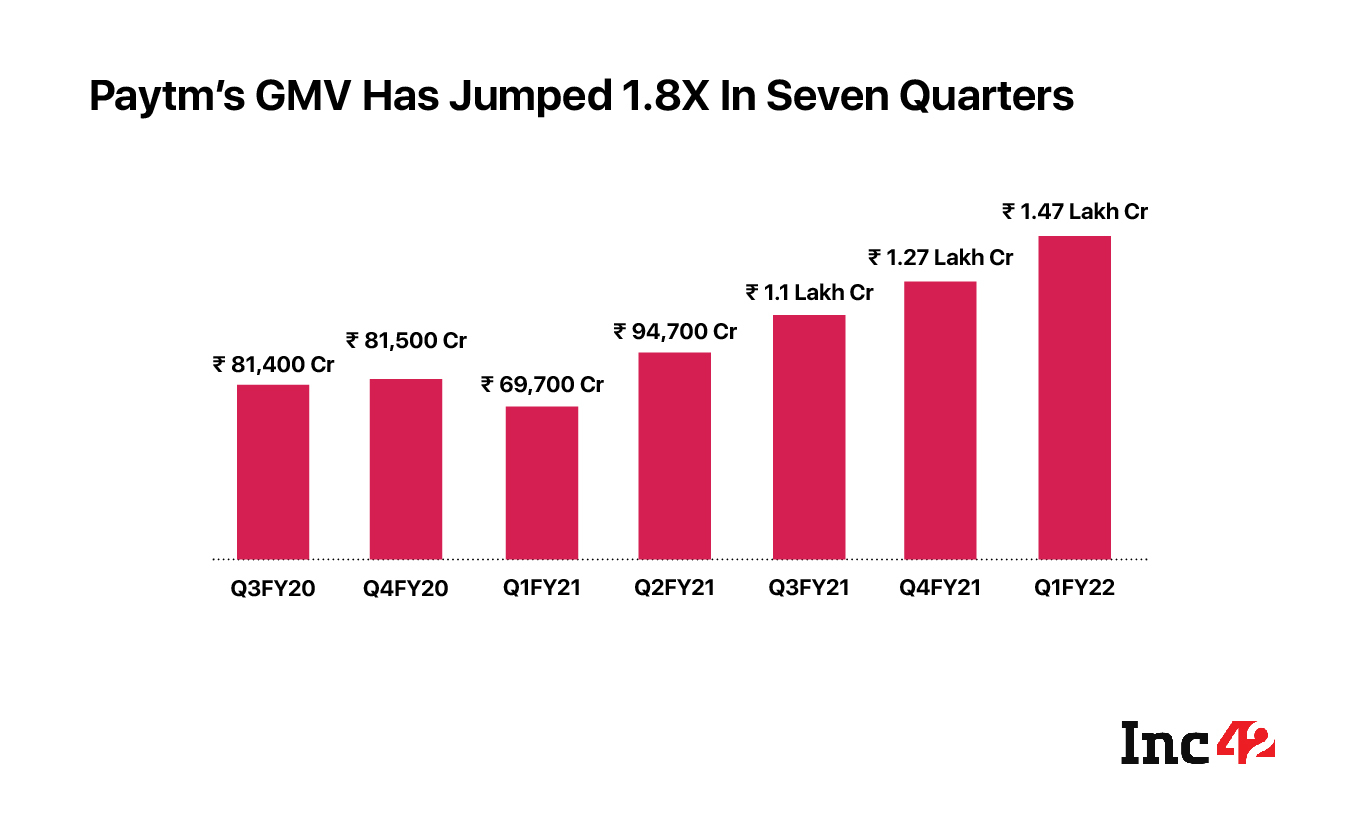
Paytm’s GMV In First Quarter Of FY22 Hit INR 1.47 Lakh Cr
One of the key drivers of Paytm’s payment and financial service revenue is the GMV that is processed on its platforms and the commission that the company makes on it. Paytm defines GMV as the rupee value of total payments made to merchants through transactions on its app, through Paytm Payment Instruments or through our payment solutions, over a period. It excludes any consumer-to-consumer payment service such as money transfers.
While the company’s GMV has been growing consistently, it experienced a hiccup in the fourth quarter of FY 2020 and in the first quarter of FY 2021 primarily due to the lockdowns imposed as a result of the Covid pandemic which reduced availability of payments use cases. Since lockdowns eased in India in the second quarter of FY 2021, Paytm’s GMV has increased consistently for the rest of FY 2021 primarily due to an increase in the transactions of online and in-store merchants. Even during the first quarter of FY 2022, which was impacted by the second wave of Covid, Paytm’s GMV grew 15.8% to INR 1.47 Lakh Cr.
Paytm Is Unit Economics Positive
One of the most important indicators of any tech business is its unit economics. It is judged on the basis of its contribution profit — which is calculated as revenue from operations minus the variable costs which are things like payment processing costs, cashbacks, etc for Paytm.
The company’s contribution profit improved from a loss of INR 1,998 Cr in FY 2019 to a profit of INR 362.5 Cr in FY 2021. The contribution margin, as depicted in the chart below, improved from a loss of 61.8% in FY 2019 to a profit of 12.9% in FY 2021.
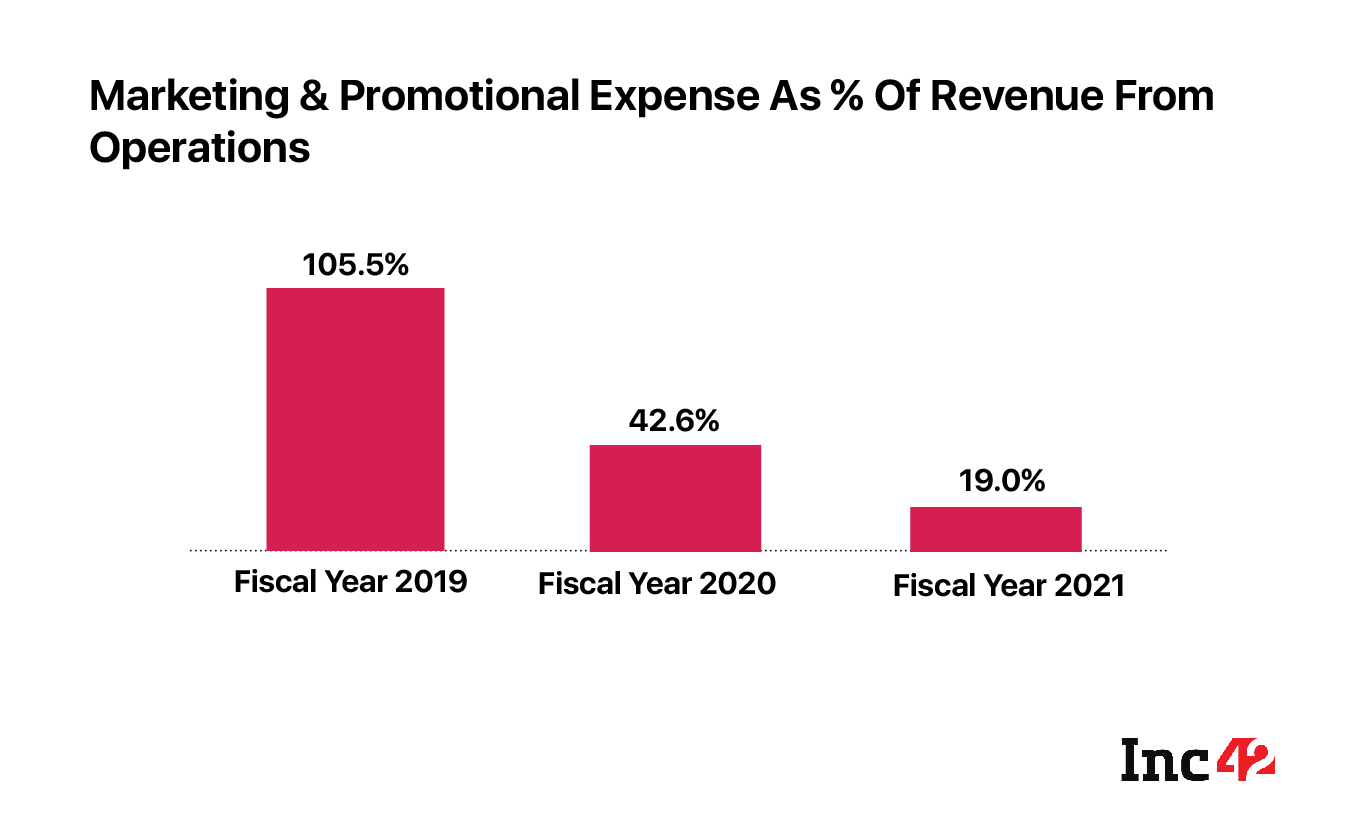
Promotional Expenses Are Decreasing Fast
Paytm’s marketing and promotional expenses, as depicted in the chart below, in FY 2021 reduced by 61.9% from FY 2020, and by 84.4% from FY 2019. As a percentage of revenue from operations, the company’s marketing and promotional expenses reduced from 105.5% in FY2019 to 19.0% in FY 2021 primarily due to a reduction in customer acquisition costs as well as retention costs, according to the DRHP.
“We used to spend $20-25 Mn a month on cashbacks before, but now we spend $1 Mn but are still gaining the market share,” Paytm founder and CEO Vijay Shekhar Sharma had said at The Makers Summit hosted by Inc42 in March this year.
Monthly Transacting Users On The Rise
One of the key metrics for any ecommerce or payments platform is the number of monthly transacting users. A monthly transacting user (MTU) is a consumer who has completed at least one successful transaction on the platform in a particular calendar month.
In the last one year, while digital adoption rose fast due to the pandemic, Paytm saw its MTU increase 22% from 41.2 Mn at the end of the first quarter of FY2020 to 50.4 Mn at the end of the first quarter of FY21.
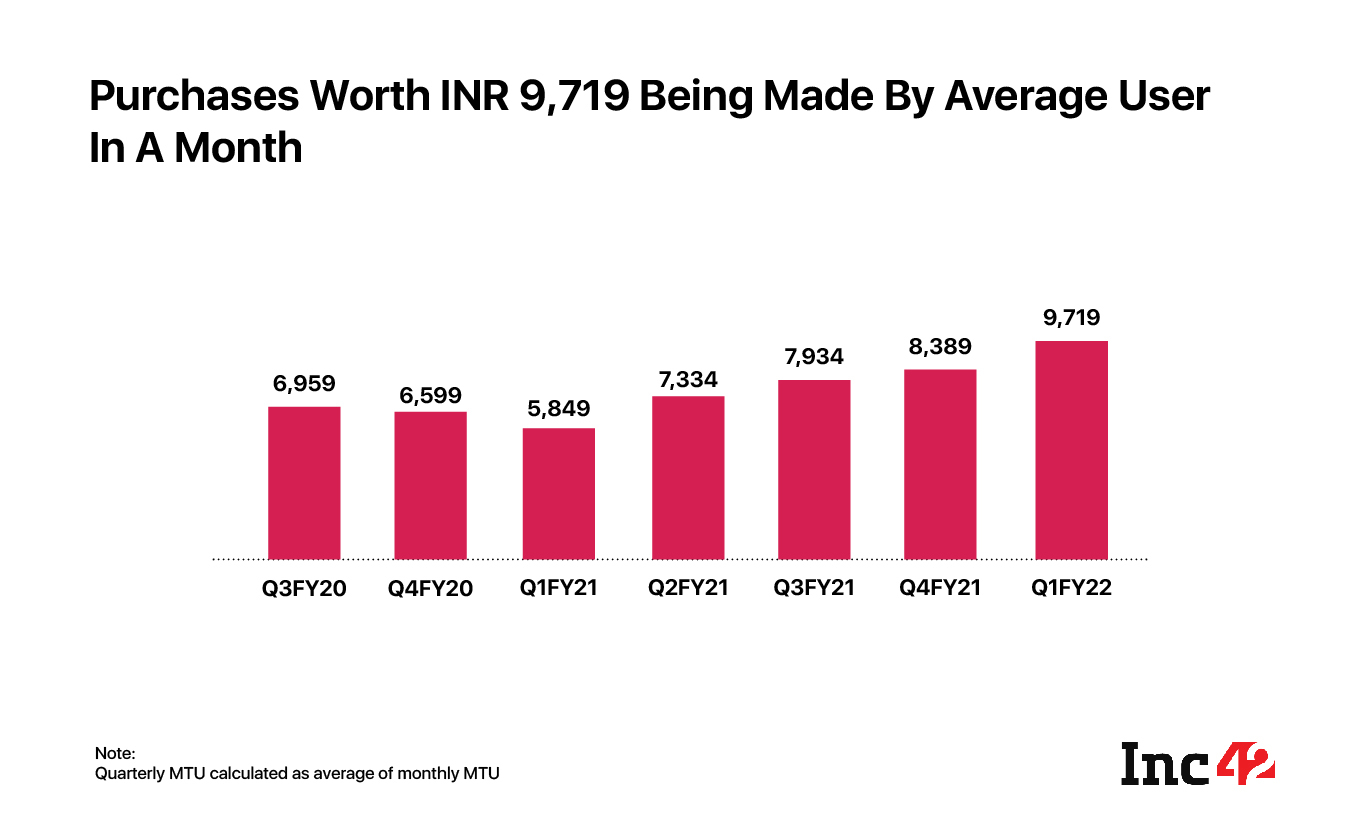
Moreover, the average amount of purchases per month made using Paytm has also been increasing. This is important because customers making payments to Paytm through different methods is a big revenue driver for Paytm — as it charges an average take rate of 0.64% on these transactions as of the fourth quarter of FY21.
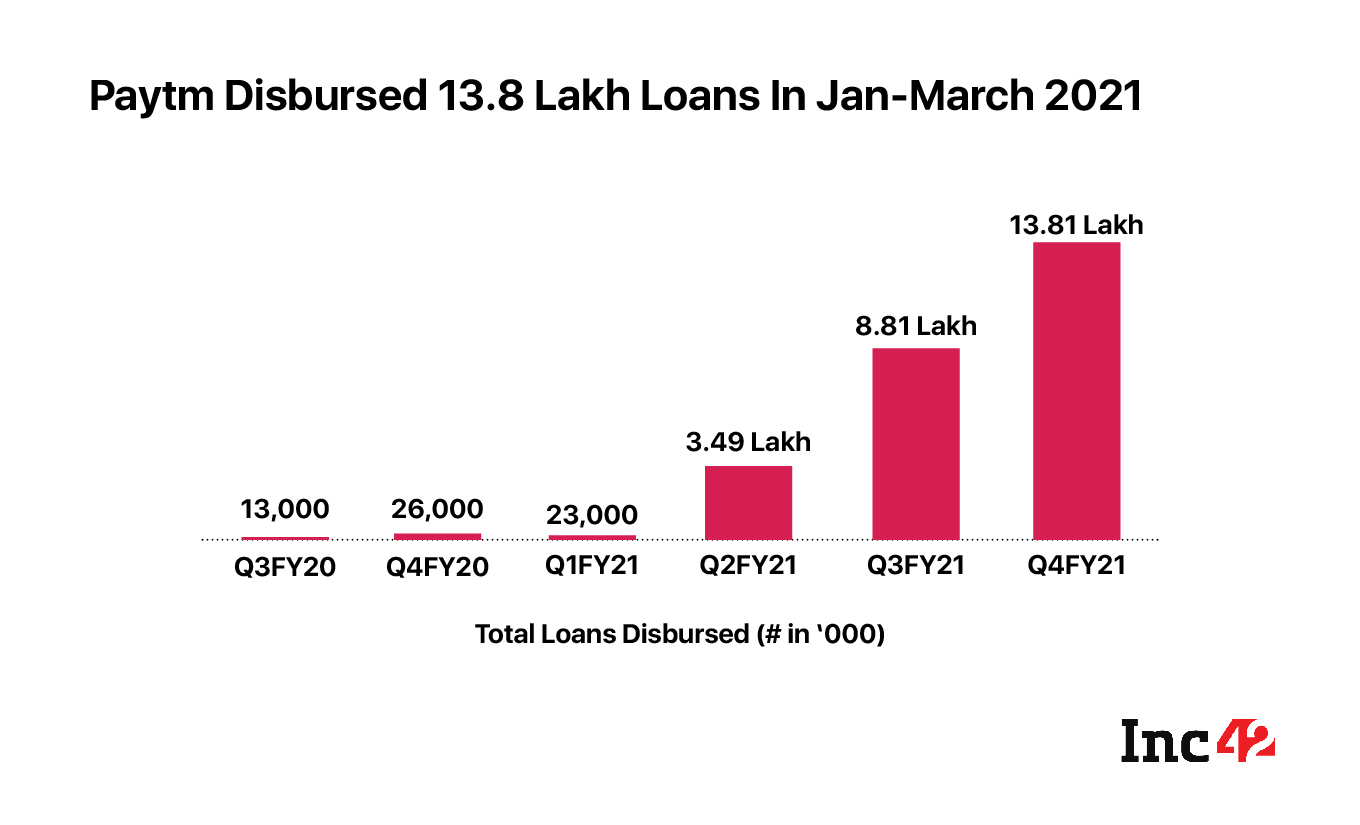
Focus On Financial Services
Paytm launched a slew of financial products last year — such as digital brokerage Paytm Money, a buy now pay later service called Paytm Postpaid, insurance brokerage, among other things.
It has over 1.3 Mn consumers in direct mutual fund investments, over INR 5,200 Cr AUM in direct mutual funds, digital gold, and stock broking investments, as on March 31, 2021. Paytm Money had 208,000 equity trading accounts as of March 31, 2021. Meanwhile, Paytm had 11.3 Mn unique insurance customers and had sold 31.5 Mn insurance-related products.
In the DRHP, Paytm says “We have been able to significantly grow our lending business over the last few quarters, primarily as a result of the growth in our Paytm postpaid product.”